Dashboard
Dashboard shows a summary of your work on Instrumentor Platform.
Dashboard displays the infomration as set of tiles:
- Total cases recorded: These are the cases you have recorded or uploaded to Instrumentor platform. This is click-able tile and will navigate you to “My Cases”
- Unique Case Types: Instrumentor counts unique types of cases you work on based on recorded or uploaded cases. This is a non-clickable, info-only tile.
- Recorded time: This shows total time for all case videos (regardless of type or if you have recorded using MediX or uploaded yourself). This is a non-clickable, info-only tile.
- Cases Shared With Others: This is count of cases you have shared with other users of Instrumentor This is click-able tile and will navigate you to “Cases Shared with me”
- Cases Shared With Me: This is count of cases other users have shared with you. This is click-able tile and will navigate you to “Cases Shared with others”
You’ll find your intra-op analytics for each case type that includes:
- Type of Case (as title of the tile)
- Number of cases: Count of cases for that type of case
- Intra-operative average time for that type of case. We calculate average from the total case video time (start to end). We do NOT consider pauses, scope-outs or any other event.
- Total recorded time for that type of case. We sum all your cases by the type and show total times as hours:mins:seconds
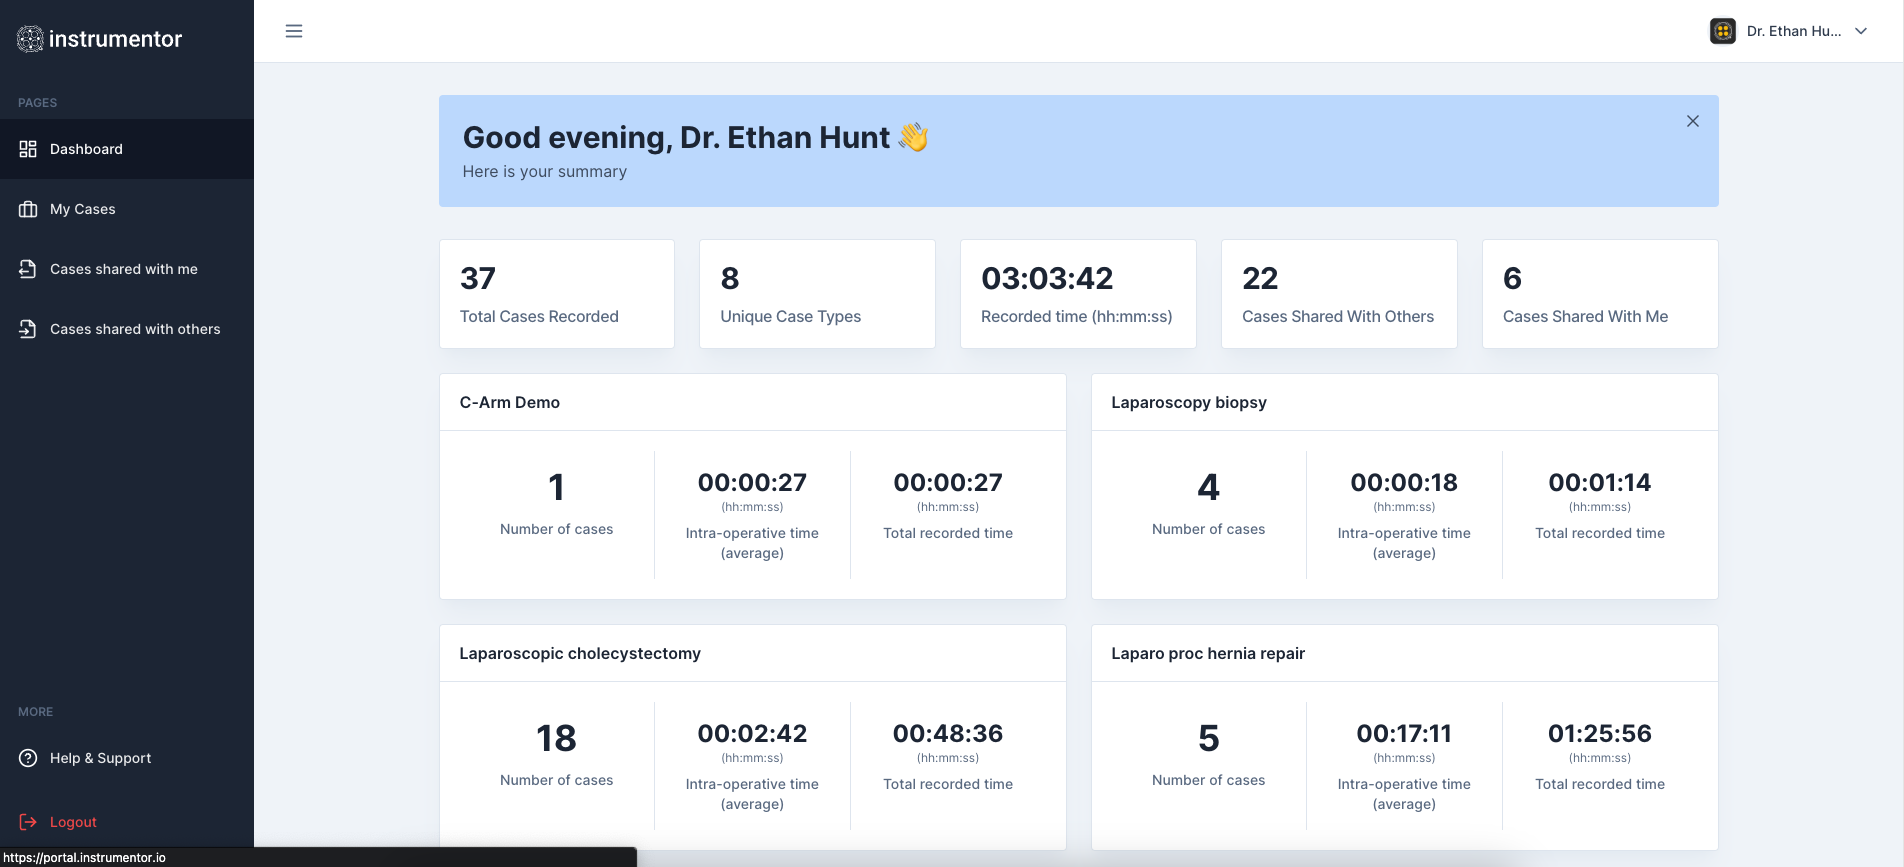
Here’s how a typical dashboard looks like